Key figures
On this table, when a statistical test has been performed, the data showing a significant difference is displayed on a yellow background, otherwise on a grey background.
Data
NIHDI nomenclature codes selected for analysis
| CODES | LABEL | CREATION | DELETION |
422225 |
Surveillance et exécution de l'accouchement par une accoucheuse pendant un jour ouvrable | 01-07-1996 | |
423500 |
Surveillance et exécution de l'accouchement par une accoucheuse durant le week-end ou un jour férié | 01-07-2010 | |
| 422656 |
Accouchement effectué per une accoucheuse à domicile pendant un jour ouvrable | 01-10-2001 | |
| 422671 |
Accouchement effectué par une accoucheuse dans le cadre d'une hospitalisation de jour pendant un jour ouvrable | 01-10-2001 | |
| 423010 423021 |
Accouchement normal ou dystocique y compris les honoraires pour l'anesthésie éventuelle, à l'exclusion des anesthésies effectuées par les médecins spécialistes en anesthésie | 01-04-1985 | |
| 423651 |
Accouchement effectué par une accoucheuse à domicile durant le week-end ou un jour férié | 01-10-2001 | |
| 423673 |
Accouchement effectué par une accoucheuse dans le cadre d'une hospitalisation de jour durant le week-end ou un jour férié | 01-10-2001 | |
| 424012 424023 |
Accouchement normal ou dystocique, y compris les honoraires pour l'anesthésie éventuelle, à l'exclusion des anesthésies effectuées par les médecins spécialistes en anesthésie | 01-04-1985 | |
| 424071 424082 |
Accouchement nécessitant une embryotomie | 01-04-1985 | |
| 424093 424104 |
Accouchement par opération césarienne | 01-04-1985 |
The codes mentioned above can be used in rates and expenses, or only in expenses. We invite you to consult the full report for more information.
Below is a graph showing the evolution of the breakdown by volume of nomenclature codes used for the rates:
 (2023)")
Population selection
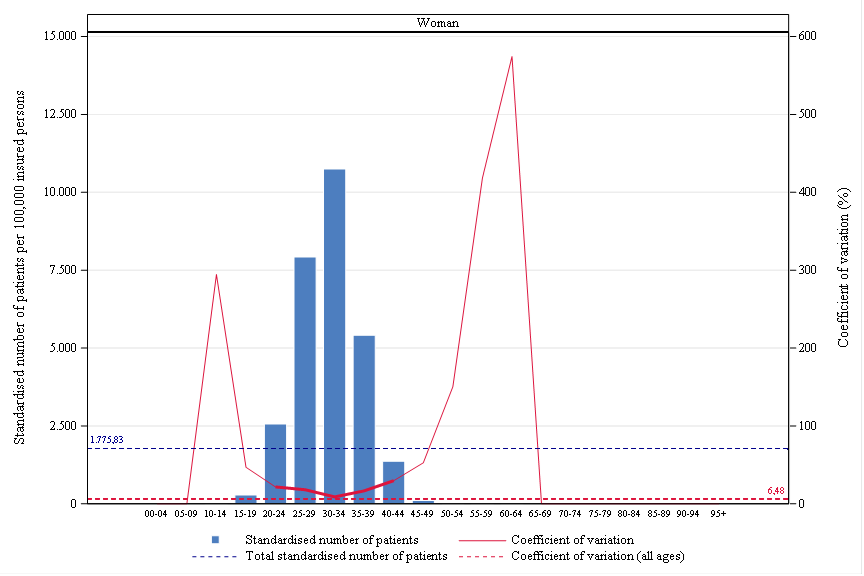
Women only (no age selection)
Analysis period
2023
Graphics
 Nomenclature codes
 Age, gender and CV
 Rates by sex
 Reimbursement rate
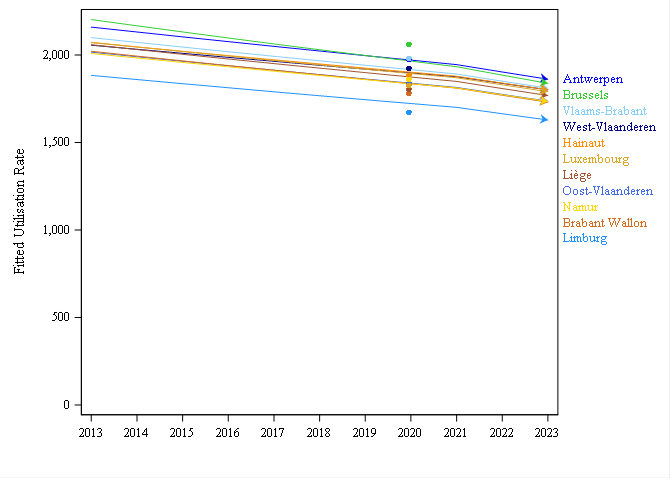
 Trends by region
 Trends break
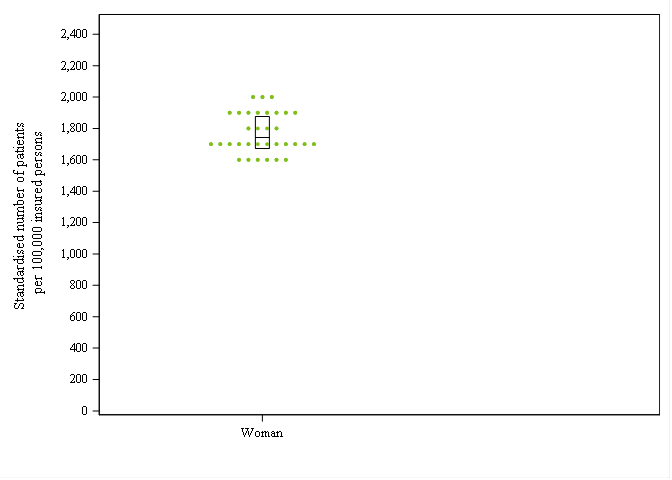
 Dot Plot
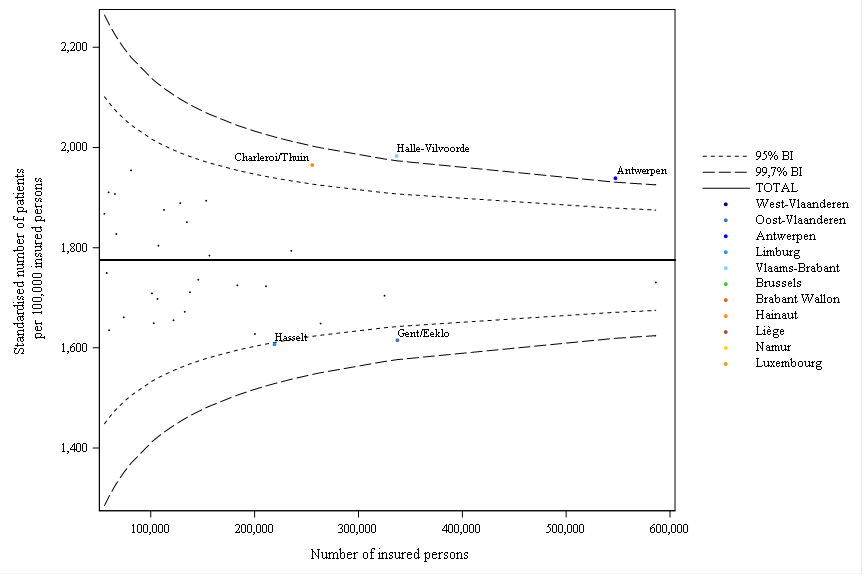
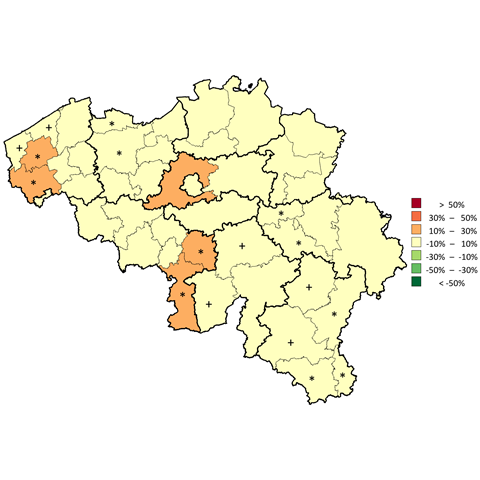
 Distribution map
 Funnel plot
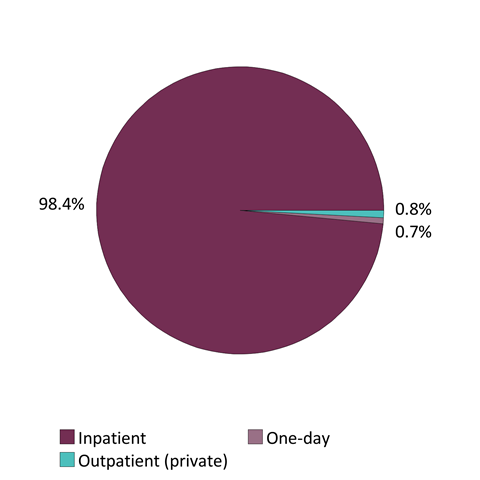
 Patient care settings
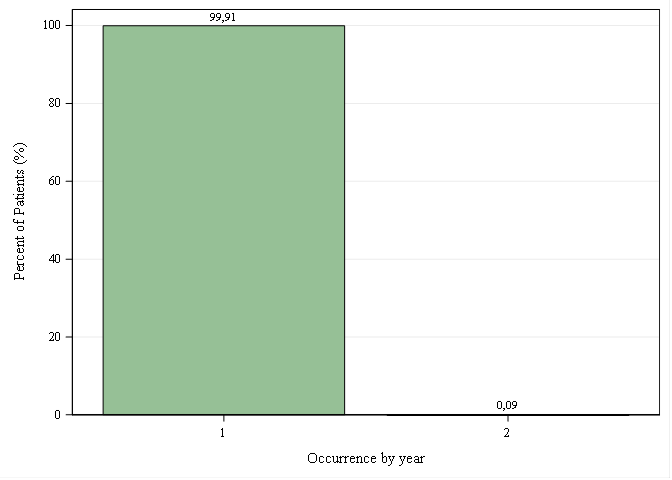
 Occurrences per year
 Occurrences per day
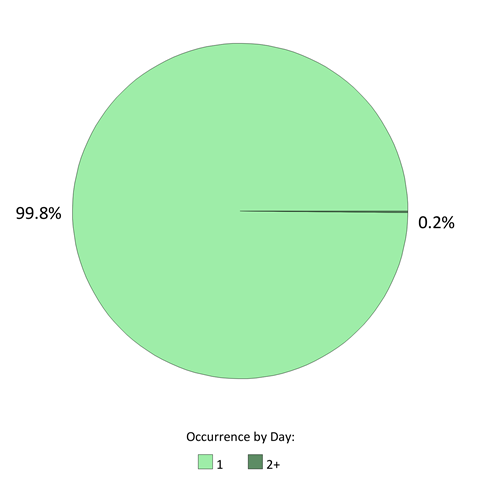


Comments
WE ARE INTERESTED IN YOUR OPINION
Do you have any experience in this area ? We listen to you !