Select your language

Other official information and services: www.belgium.be  belgium

  •  Key figures
  •  Data
  •  Graphics
  •  Comments
PROVIDERS & PRESCRIBERS    
Main healthcare providers: Non-specialized physicians 100.00%  
Main prescribers: Not applicable -  
RATE OF USE    
Average number of interventions (per year) 1,607,931  
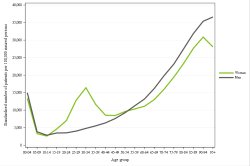
Standardised rate of use (per 100,000 insured persons) 14,024.48
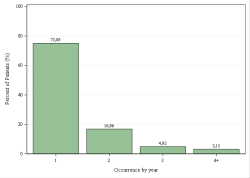
≥ 2 occurences per patient 2019   25,6%
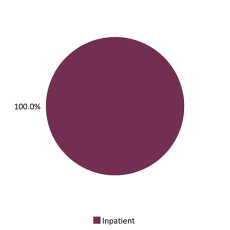
Percentage of outpatient care 0.00%
POPULATION    
Median age 59 years
Max/min ratio of the median age (by district) 1.31
Percentage of women 54.30%
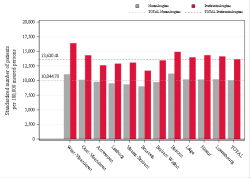
Ratio Preferential scheme/General scheme 1.57
TRENDS    
Trend 2011-2021 -1.52%
Trend 2011-2019 -0.52%
Trend 2019-2021 -5.39%
GEOGRAPHICAL VARIATIONS    
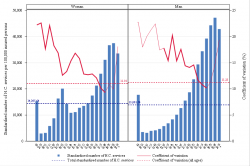
Coefficient of variation 2011-2013 7.22  
Coefficient of variation 2019-2021 12.25
Max/min ratio of number of interventions (per 100,000 insured persons, by region) 1.14
Max/min ratio of number of interventions (per 100,000 insured persons, by district) 1.92
DIRECT EXPENDITURE    
Average annual expenditure 95,878,183  
Average annual expenditure per insured person 8.36  
Max/min ratio of expenditure per insured person (by region) 1.21  
Max/min ratio of expenditure per insured person(by district) 1.87  
Average cost of interventions 59.63  


On this table, when a statistical test has been performed, the data showing a significant difference is displayed on an yellow background, otherwise on a grey background.

CODES LABEL CREATION DELETION

460784
Imagerie médicale - Radiologie, article 17, honoraire forfaitaire d'imagerie médicale par admission 01-07-1999  

The codes mentioned above can be used in rates and expenses, or only in expenses. We invite you to consult the full report for more information.

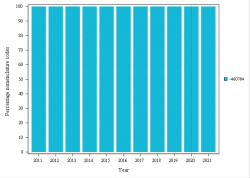
Below is a graph showing the evolution of the breakdown by volume of nomenclature codes used for the rates:

Forfaitimageriemedicaleparadmission Nomenclature

No selection


2021

  • NomenclatureNomenclature codes
  • Age Gender CVAge, gender and CV
  • Rates by sexRates by sex
  • Reimbursement rateReimbursement rate
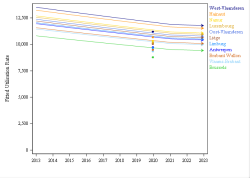
  • TrendsTrends by region
  • Trends breakTrends break
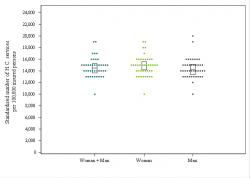
  • Dot PlotDot Plot
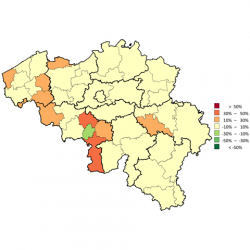
  • MapDistribution map
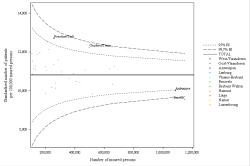
  • Funnel PlotFunnel plot
  • Patient care settingsPatient care settings
  • Provincial OccurrencesOccurrences by Province
  • National OccurrencesNational Occurrences


WE ARE INTERESTED IN YOUR OPINION

Do you have any experience in this area ? We listen to you !
Whether it is on the very validity of the analysis or on the interpretation of the data, a tool has been specially designed to enable you to give your opinion and contact us. Please download the tool below (in French)* and use it to send us the information you wish to send us. Then simply send it by email. This information is valuable to us.

Thank you very much for your interest and collaboration !

Download the tool

*The tool is updated regularly, make sure you have the latest version which is the one available here.


 CONTACT

Send us an email

Download the full report
Download the methodology